System Design 102
More basic System Design concepts every Software Engineer should understand

The second part is never as good as the first one, except Nolan's Batman. But I'll try to do my best.
People and computers live now in symbiosis. And this is not a coincidence. Back in 1960 J. C. R. Licklider wrote about this symbiosis and then spend most of his career working on it and funding projects at ARPA that made it a reality. Licklider was originally a psychologist and the Internet exists mostly because he actively pushed people towards building an Intergalactic Computer Network.
Why am I telling you this? Because Software Engineering is about interacting with computers and telling them what to do. Limitations and problems arise mostly because we are human. Conway knew this better than anyone.
Any organization that designs a system (defined broadly) will produce a design whose structure is a copy of the organization's communication structure. — Melvin E. Conway
So let's be honest for one minute here. At some point in your life you will split a monolith. And it will be mostly because you are human and not so much because it makes sense. By doing so, you enter the world of distributed systems. And you may be scared at first, and with good reason. But keep reading.
Meiosis
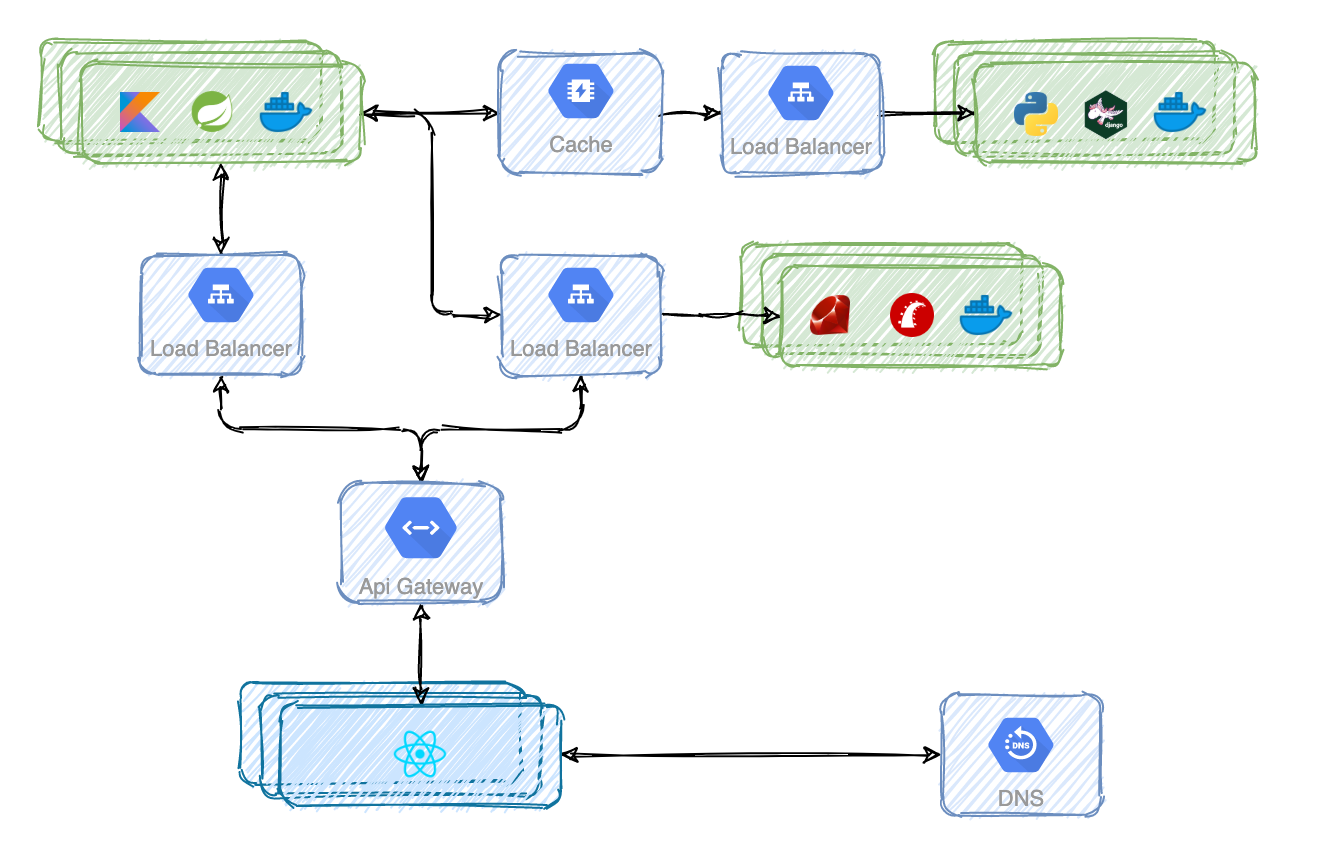
There are many ways of splitting a monolith but in any of them you will remove complexity from a codebase and add it to the system. Code you just used to invoke is now spliced across multiple services. And those services need to communicate between each-other. And that's going to be your challenge.
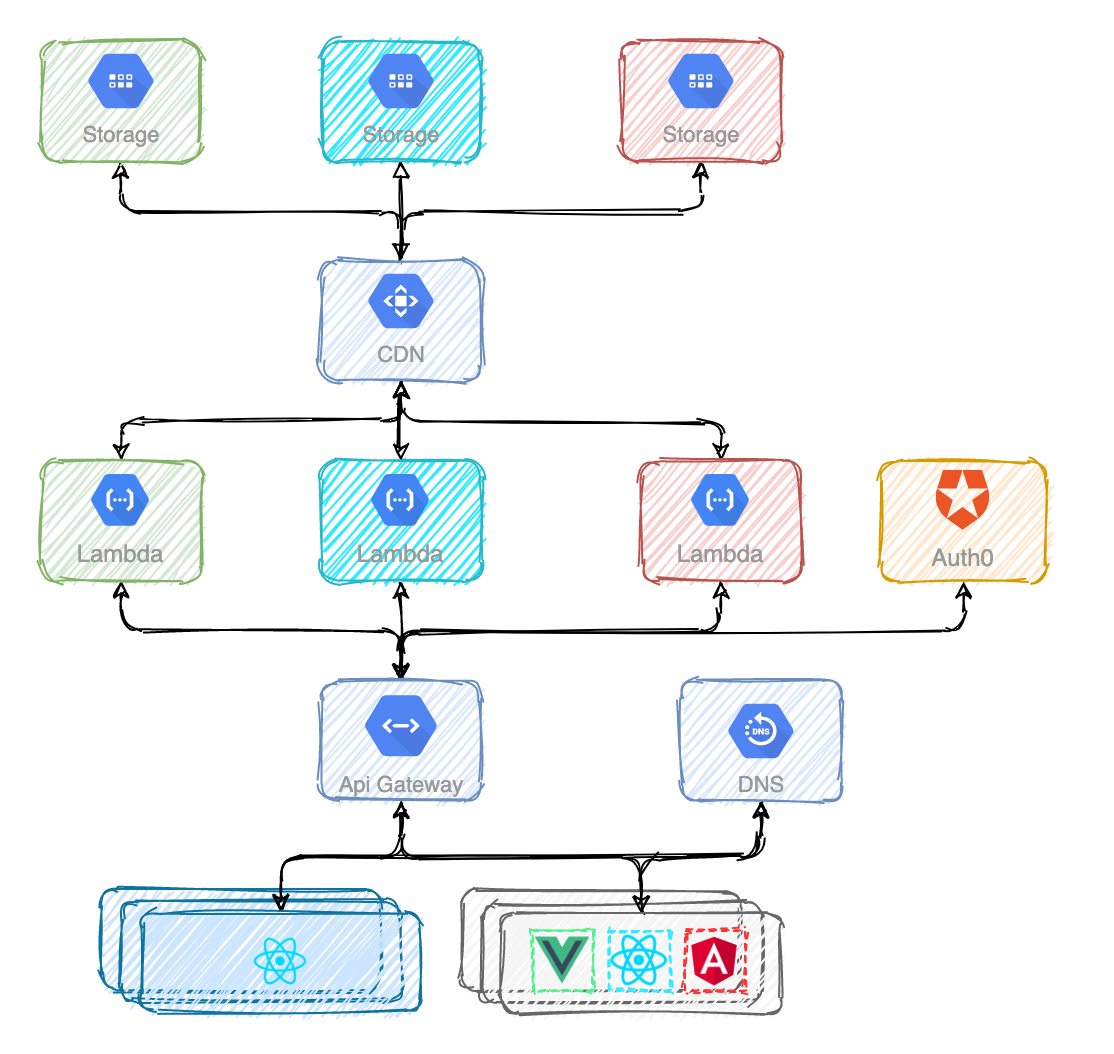
If the diagram above seems messy it's because it is. The frontend application is interacting with multiple backend services.
Baldur's Gate
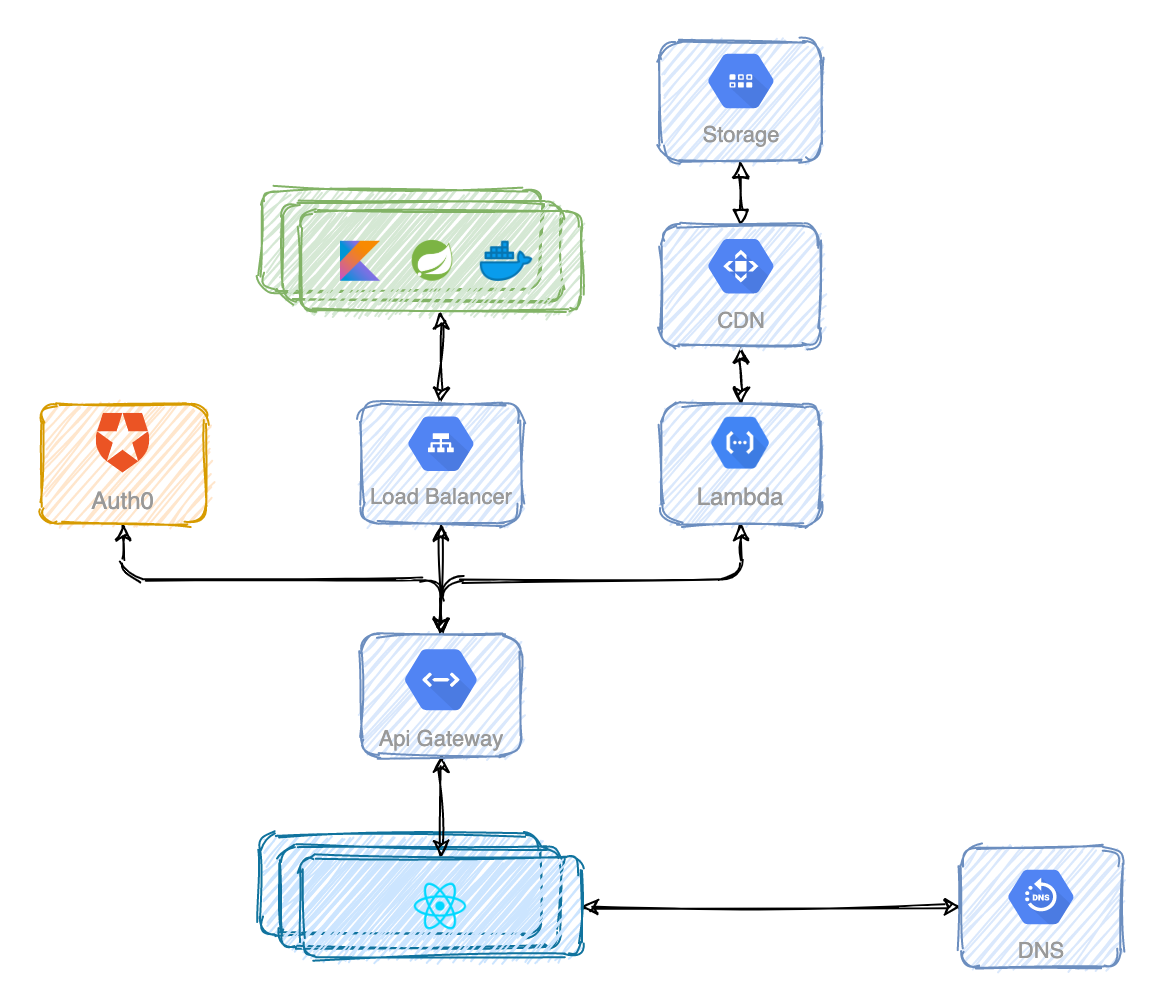
I've never played the game but I assume it has something to do with finding your way to some kind of unique gate. I'm sorry for the bad joke. The point is that instead of exposing the internal design of the system, it would be really nice to have a single interface. It would give the illusion of interacting with one backend service only. That gate would provide a cohesive, uniform and unified experience. To achieve that you can use a reverse proxy usually called an API Gateway. Some of the most famous are Kong Gateway and the one AWS provides.
And you can use API Gateways for so much more:
- Authentication. Instead of letting every backend service handle authentication you can leverage on the API Gateway to do it.
- Traffic Control. Rate limit, throttle and restrict traffic. You want to protect your services from DDoS attacks.
- Analytics. Visualize, inspect, and monitor backend services traffic. At some point you'll want to understand how your APIs are used.
- Logging. Stream request and response data to logging tools.
- Transformations. Transform requests and responses on the fly.
- Serverless. Invoke serverless functions via APIs. Yeah. For real.
Call me maybe
Once you've solved the communication problems of the backend services with the frontend applications, it's time to solve the ones between the backend services themselves.
Of course you can use old fashioned HTTP to communicate between services. But if you are monitoring at least the 4 Golden Signals you will definitely see an increae in latency. Guess what. HTTP takes more time than invoking a function. So no, even if your code is isolated, you can't ignore the design of your whole system.
Don't get me wrong. This is not bad design and in most cases it will probably work for some time. But eventually you'll need a more decent solution.
At some point, latency will become a problem and somebody with more experience than you in System Design will propose to use some kind of asynchronous communication between services whenever possible.
In the previous post I've already explained the message queues and more specifically the task queue, aka work queue, pattern.
A publisher distributes tasks through a queue of messages among workers that compete to consume them. Only one instance consumes the message and executes the task/work.
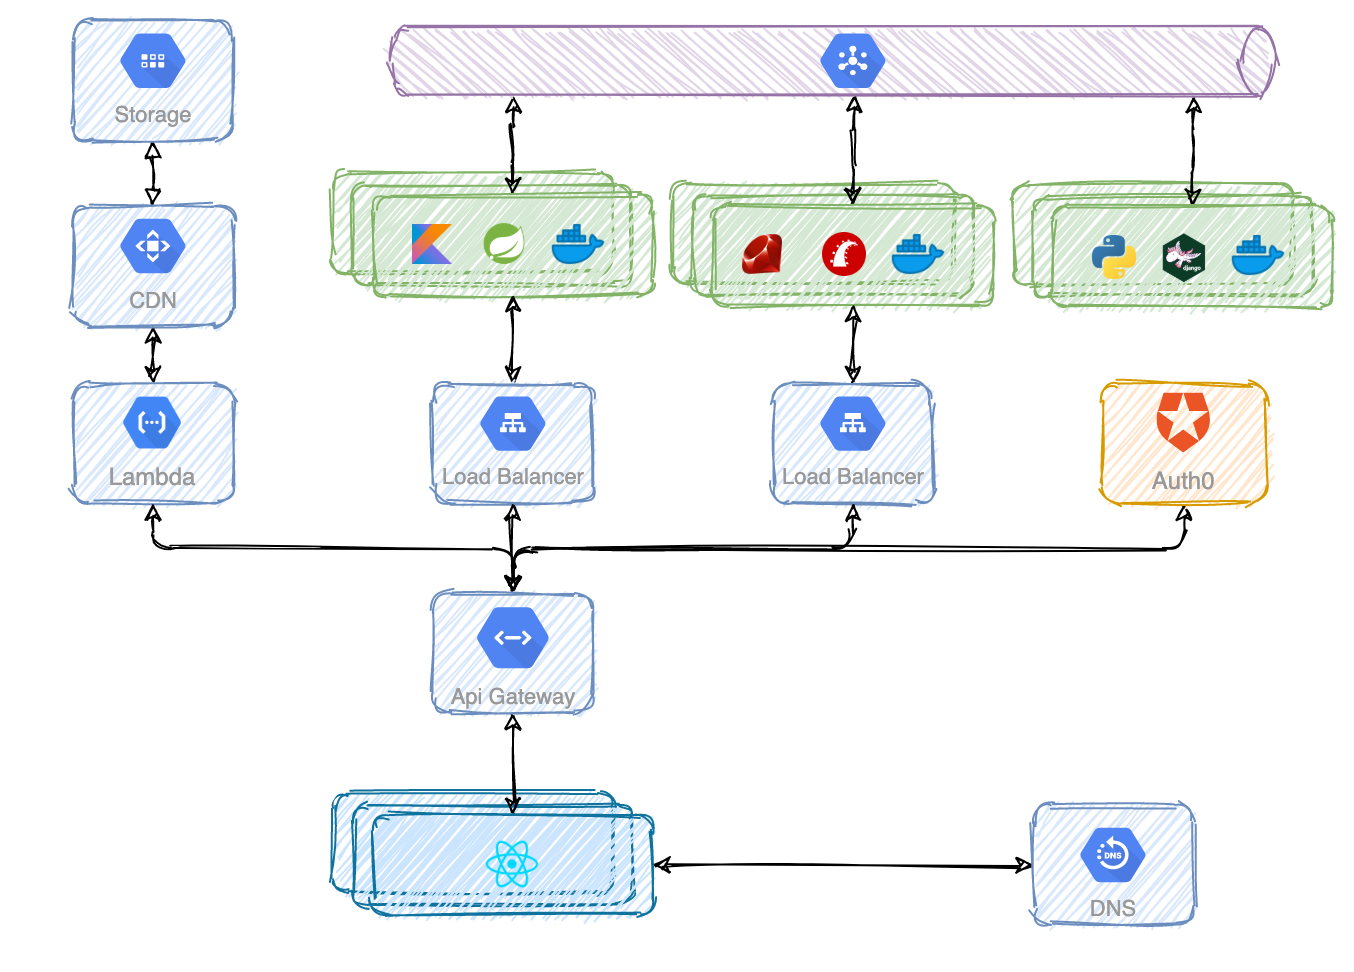
But what if you want to asynchronously deliver messages to multiple services at once? It turnes out RabbitMQ, Apache Kafka and Google Pub/Sub allow a service to deliver a message to multiple consumers. This pattern is known as publish/subscribe.
You don't need to worry about what happens underneath but it's good to understand the core idea of the pub/sub pattern. The publisher aka producer never sends any messages directly to a queue. Actually, quite often the producer doesn't even know if a message will be delivered to any queue at all.
Instead, the producer only sends messages to an exchange. An exchange is a very simple thing. On one side it receives messages from producers and the other side it pushes them to queues. Every service has its own queue and only one instance consumes the message.
Putting all the pieces together you can see a more complete vision of the system. Now it all makes sense again.
Mitosis
The first approach to splitting a frontend monolith couldn't be simpler. You can literally split it in two. You can store the static assets in different storages and that's mostly it.
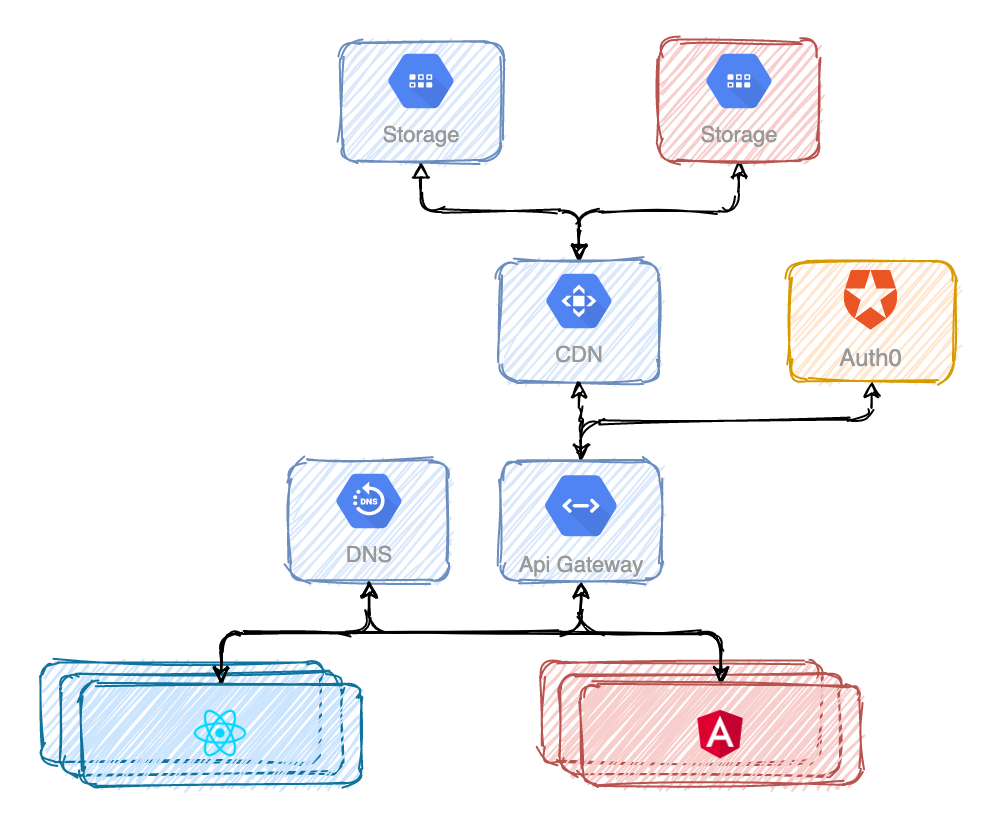
However. Managing the state and the authentication for just one application is straight forward. But what happens when you split it? It would be terrible UX if somebody navigated from one application to another and needed to authenticate again. Navigating between applications should be unnoticeable to anybody.
Your first thought could be to store a JWT token in the local storage. Stop. Don't do that. The local storage is designed to be accessible by javascript, so it doesn't provide any XSS protection. Instead, use an http only session cookie.
Divide and conquer. Or not
You've already heard of microfrontends. An approach that intends to help you scale development so that many teams can work simultaneously on a large and complex product. I won't talk about any implementation details. Nor server side rendering. I just want you to understand that splitting frontend applications is not just about code. It always has infrastructure consequences.
Splitting applications won't reduce complexity. You will just distribute it across the system.
The more you know
Distributed systems are the norm today. But it wasn't always like this. So allow me a short history lesson. Computers used to function in isolation. That was until ARPANET was born in 1969 after a birth that lasted several years. The first distributed system. Kind of.
One of the first four nodes was the University of California, Los Angeles. They had some of the needed infrastructure in place because they already tried to connect UCLA's campuses some years before, but because they didn't get along, they failed. After that first attempt, the UCLA redirected its forces to another project that aimed to measure how bits moved from one place to another in a computer system.
Len Kleinrock from UCLA, who was involved in the design of the ARPANET, demanded to measure everything that happened in the network. They wanted to measure how many packets were traveling on the network, where digital bottlenecks were forming, where were the bottlenecks, what speed and capacity could be achieved in practice and what traffic conditions would break the network.
If you look closely, it is very similar to the 4 Golden Signals that are attributed to Google today. Nothing could be further from the truth. The thing is, we like to reinvent the wheel every few years.
UCLA was interested in measuring, yes. But who cares? So, building on the foundations of a failed project and the pull of the monitoring project, UCLA became the ARPANET Network Measurement Center. This was 1969. Just when The Rolling Stones were considered the largest rock band in the world. If 50 years ago - yes, 50 years ago - they worried about monitoring, why wouldn't you today?
Look at me
I'm not here to tell you what to monitor. That is a topic for a future post. I only want to give you a basic idea about how monitoring tools usually work underneath.
More traditional tools push metrics to the metrics server, aka Aggregator. Usually you'll have to install an agent alongside your service. Sometimes in the same container. Other times in a sidecar container. You'll have to configure when, where and how often to push the metrics. Sending metrics is not the primary goal of your service so instead of pushing one by one, you'll also have to decide if and how the metrics should be aggregated before pushing them. Although, if you use something like New Relic, you won't have to bother about the implementation details.
But you can architect the monitoring system in a way completely transparent to your services. Pull based tools like Prometheus make that possible. Because the configuration is not tied to the services, you no longer have to re-deploy your services if you want to change it.
Here is how a pull based monitoring tool could work:
- Your services should all have a
/metricsendpoint. This is very common and you can find many libraries and frameworks that do this. - The Aggregator needs to know where the target services are. You can define them statically but what would happen if an IP changes? Or if a service goes down? Better to use some kind of Service Discovery that will automatically tell the Aggregator where to pull the metrics from. Maybe use Consul for that.
- The Aggregator regularly sends and HTTP request to the
/metricsendpoint. Sometimes called a scrape. The response is parsed and ingested into the local storage. - Some services are difficult to instrument. You can use an Exporter to deploy right beside the service you want to pull metrics from. That Exporter will provide the
/metricsendpoint. - You want to visualize and analyse the metrics somehow. You could use Grafana which is the leading open source software for time series analytics. It allows you to query, visualize and understand your metrics.
- Some metrics aggregators like Prometheus can also be configured to send alerts when something unexpected happens. An Alert Manager can receive alerts from the metrics server and turn them into notifications.
Read me
Logging is also another useful mechanism that provides visibility about the behavior of a service. Traditionally, it was common to write the logs to a file on disk (a “logfile”). But nowadays a service shouldn't concern itself with storing logs on disk. Instead, it should spit the logs to the standard output. There are many benefits of doing that. During local development, you can see these logs in your terminal.
In a production environment the logs will be forwarded to a log processor as Fluend. They will be filtered and then stored in a proper database as Elasticsearch. As with metrics, you need to search for, visualise and analyse the logs with a tool like Kibana.
Are we there yet?
I know we've talked about many different concepts. And this last part about the metrics and logging wasn't easy to grasp. Read the post again and follow the resources I provided. We haven't finished. Not really. Distributed systems handle distributed data. And that's going to be the topic for the next post. And we haven't yet talked about Kubernetes.